Leveraging data to conserve water resources
Abstract
Municipal water conservation efforts across the United States typically operate on finite budgetary resources and must, as a result, take a lean approach to their mission of reducing water waste. Identifying innovative opportunities for conservation can be difficult given these limited resources. Municipalities often possess an abundance of digital data utilized in day-to-day operations for specific, individual purposes – by combining and visualizing these disparate data sets, a cost-effective way of conducting water conservation analysis emerges. I introduce a study into the City of Rio Rancho’s data sets, which are common to municipalities across the country. I then outline a method for combining and visualizing this data, yielding an easy-to-analyze GIS data set that allows water conservation specialists to identify possible sources of water waste. Several use cases present ways in which the GIS data set can be used to make informed conservation decisions. Through creative utilization of existing municipal data, water conservationists are thus empowered in their efforts to reduce waste.
Introduction
The City of Rio Rancho currently maintains a wealth of municipal data on its internal computer systems. Employees of various divisions interact with different subsets of this data on a day-to-day basis, be it for use in making engineering decisions, resolving account discrepancies, or for scheduling water use audits for customers with unusually high monthly water consumption. In comparison to other cities its size, Rio Rancho’s data is consistent, well-maintained, and diverse. This provides a unique opportunity to conduct cross-cutting analysis – in this case, with the goal of furthering the City’s water conservation efforts.
Rio Rancho’s water conservation (itself an interdisciplinary field) depends in part on the City’s ability to make effective marketing and customer service decisions, and on access to useful investigative tools. Traditionally, the City’s data exists in silos – Engineering, Accounts, etc. – without much overlap. Employees of each division of city government interact exclusively with data that supports their individual mission, without much merging or cross-referencing of these data sets. A primary goal of this project, then, was to imagine ways in which the City’s separate data sets could be combined and used creatively to empower the City’s water conservation specialists.
The resulting project was the creation of a robust geospatial data set – a tool which allows city water conservation specialists to make more informed marketing and customer service decisions, as well as enabling them to identify potential opportunities for waste reduction. Using this data, it is believed that conservation specialists will be empowered in their efforts to further reduce water waste, energy use, and pollution [1].
Methods
Sensitive portions of this section have been omitted.
Work on the project began with an investigation into the types of data available to City employees, its format, and its potential uses. Next, a workflow was established to allow for fast imports, mergers, and analysis to be conducted. Finally, standardizing the process for merging data sets was necessary so that City employees could conduct future investigations.
Data Sets
Identifying which data sets were available for use, their formats, and how they are accessed was the first step in conducting analysis. Variables significant to water conservation specialists were first considered so that the resulting merged data set could be used for meaningful analysis.
Variables of interest to water conservation specialists include:
- Water consumption history
- Location
- Customer metadata
- Maintenance history
- Water meter type
- Water meter age
- Production well location
- Source water quality
After communication with employees across several divisions of the Public Works department, the following datasets were determined to be relevant to water conservation goals and worth including in the workflow.
Data sets omitted.
Workflow
Developing a standard procedure for the collation of the water conservation data set involved determining the path-of-least-resistance for extracting and importing each data set. GIS and CSV data is readily accessible and, when formatted correctly (with full street address), is straightforward to import and merge using QGIS or ArcGIS having prior knowledge of the software and GIS in general. Accessing municipal billing data, however, requires assistance from the City’s IT department. The standard procedure consisted of three primary steps, presented here without detail in the interest of brevity:
- Extract and format water consumption data from billing systems
- Merge water consumption data with parcel data in GIS
- Merge additional GIS/CSV data with parcel data as needed
Results
The resulting data set provides water conservation specialists with a useful resource for making conservation-related decisions, with the hope that they are empowered to substantially reduce water use, water waste, and thus energy use and pollution. Since its applications are relatively open-ended, it is presented here in terms of several use cases.
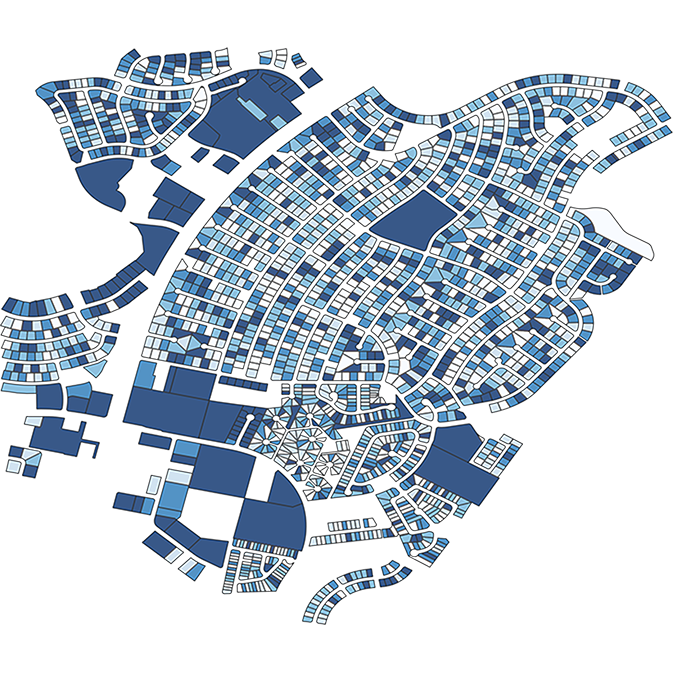
Water Use Wetmap
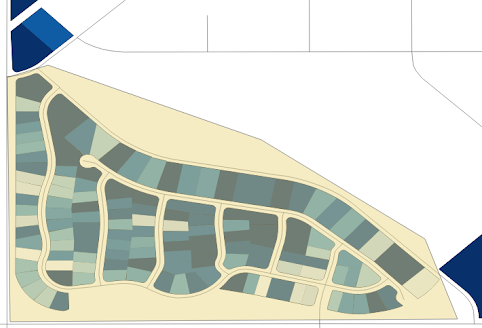
Water consumption data merged with parcel data by address allows analysts to view and explore city water users in a GIS data set which presents water use visually using a “wetmap.” Using functionality of GIS software, parcels are color-coded according to their water use data. Darker parcels have higher monthly consumption.
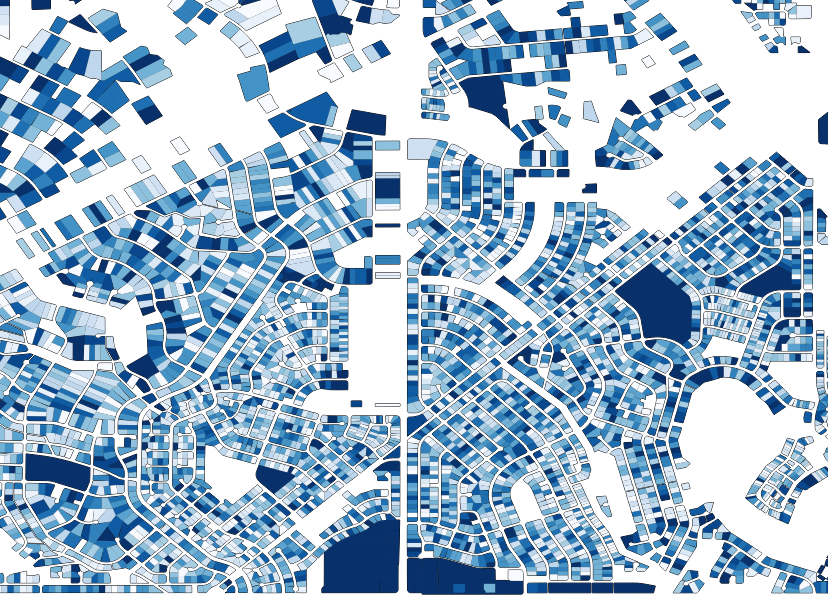
Use Case: Abnormal Water Consumption
A water conservation specialist might be interested in which neighborhoods or subdivisions have above-average water use. Using GIS software, the data set can be filtered based on a certain consumption amount, displaying only neighborhoods which, in this case, have water use above 140 units for the year.
Central to this image, the conservation specialist spots an entire neighborhood of small residential lots using above 140 units of water per year. On further investigation of the data set, each lot is a part of a country club community. The specialist may then choose to contact the homeowner’s association to organize a water conservation workshop, organize a targeted mailing campaign, or further investigate the cause behind such abnormally high water use.
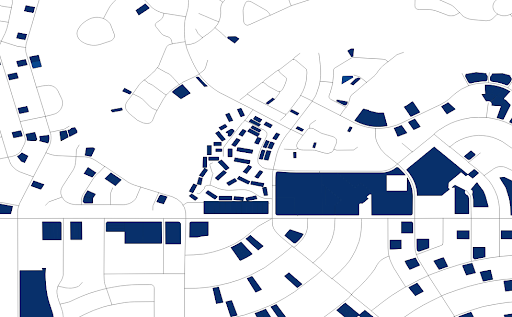
Use Case: Water Meter Inaccuracy
Studies show that water meters with low flow rates are more likely to read inaccurately, leading to non-revenue water loss [2]. A water conservation specialist might be tasked with determining which meters of a specific type are reading below-average yearly water consumption. In this case, the data set is filtered based on meter manufacturer and water use.
The filtered data yields an older neighborhood on the northeast side of town with old meters and abnormally low water use. The conservation specialist can then investigate additional circumstances behind the neighborhood – are the houses vacant, have leaks been reported, etc – and formulate an action plan to remediate possible meter inaccuracies, thus saving water.
Studies have also shown that water particulate content can affect meter accuracy–sandier water damages meters, causing them to read inaccurately [2]. Viewing neighborhoods relative to production wells and their water quality could also assist a specialist in determining which water meters are more likely to be inaccurate. In this image, production wells with harder water (possibly correlating to higher particulate content) are shown as more red.
Image omitted.
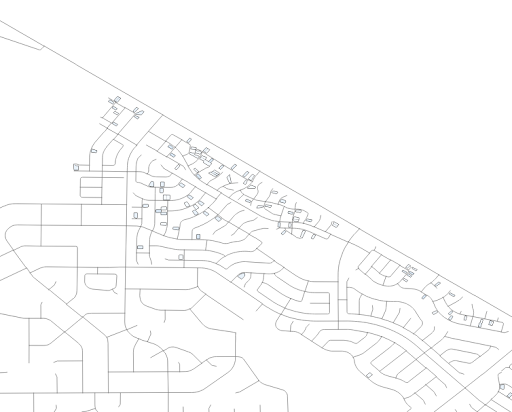
Use Case: Concerned Citizen
John Doe, head of his neighborhood’s HOA, calls the City’s water conservation hotline because he suspects the neighborhood’s overall water use is above average due to his neighbor’s refusal to xeriscape her lawn. Though it would be ill-advised to give Mr. Doe personally identifying information that could potentially exacerbate tensions between him and his neighbor, the conservation specialist may be interested in knowing whether or not the neighborhood’s water consumption is truly above average. Using the data set, the analyst locates the neighborhood and draws a GIS layer around its boundary.
GIS software can then be used to perform a “spatial join” and find the average of water consumption within the boundary – in this case, water consumption for the neighborhood is slightly above average, though it is apparent that more than one home is responsible. The specialist can then inform Mr. Doe that, while the neighborhood’s consumption is above average, several homes are responsible and the neighborhood could benefit from a variety of water conservation resources provided free-of-charge by the city.
Summary of P2 Program
NMED’s P2 program, without which this project would not have been possible, provided me with a unique opportunity to apply some of the higher-level skills learned in my degree studies to a project of personal interest. Data science and GIS, as well as a variety of other skills that were applied to this project, are not a part of the computer science program at UNM – however, the algorithmic, critical thinking, and problem solving skills that are taught to CS students were essential. I believed before entering the program that applying computing principles to conservation efforts could be a valuable exercise. I completed the internship feeling more confident in this belief.
The data structures, logic concepts, and programming paradigms that CS students learn through the degree can seem far removed from the real world; that is, environmental or social issues that may be of concern to them. Attending the week-long P2 orientation gave me an opportunity to step outside of that bubble and learn about environmental topics that I imagine were somewhat more familiar to the chemical, civil, mechanical, and electrical engineering students that I accompanied in the program. Feeling more informed as a result of that orientation, I started at the City with a strong mix of familiar CS topics and new information. The welcoming and open attitude of the City of Rio Rancho’s engineers, water conservation specialists, and contractors made it easy and rewarding to pursue my ideas and figure out how to make the most meaningful use of my time there. Though my time with the City was limited, I feel like I developed a greater sense of context within the complex world of “sustainability” as a person studying something traditionally seen as unrelated.
Given my experiences, I would certainly encourage fellow computer science students to apply for the program. Though it may seem as if algorithms and data structures have nothing to do with sustainability, the type of systems-oriented thinking required of computer science students is much-needed in the realm of conservation. If we view our finite natural resources the same way we, for instance, view memory in an embedded system – if we ensured the scalability of society in the same manner we engineer the scalability of a software system – we can go a long way in supporting efforts to sustain ourselves on Earth for years to come.
References
[1] National Academy of Sciences, Computing Research for Sustainability, 2012
[2] Water Research Foundation, Accuracy of In-Service Water Meters at Low and High Flow Rates, 2011